10 Years Post-Paris: How emissions decoupling has progressed
Global CO2 emissions are still rising, but this masks a striking shift beneath the surface: a growing share of the world economy is now managing to grow while cutting CO2.
Last updated:
Decoupling — breaking the link between economic growth and emissions — is no longer theoretical. It is happening at scale.
Using the latest Global Carbon Budget data, and a more detailed classification system than previous studies, we assess decoupling across 113 countries representing over 97% of global GDP and 93% of global emissions. Our approach evaluates not just the number of countries decoupling, but their share of global economic output and emissions, and tracks progress across multiple time periods.
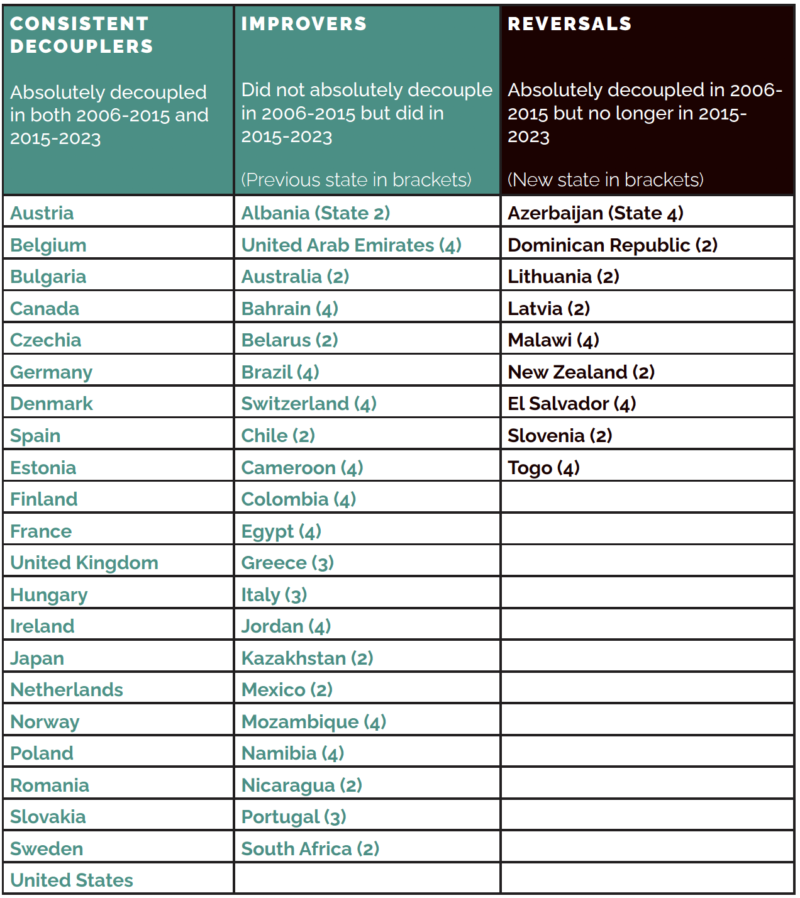
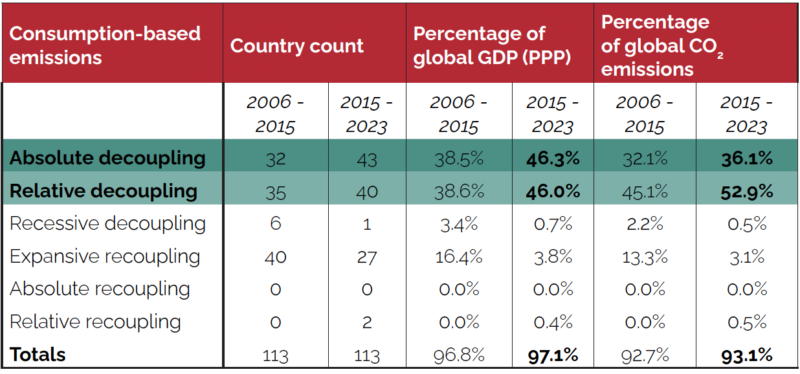
In the decade before the Paris Agreement, 32 countries absolutely decoupled emissions from GDP, with 35 more achieving relative decoupling. In the post-Paris decade (2015–2023), these numbers grew to 43 and 40 countries respectively. Today, countries responsible for 46.3% of global GDP and 36.1% of global emissions have absolutely decoupled. Overall, 92% of global GDP and 89% of global emissions now sit in economies that have decoupled in either relative or absolute terms.
Countries once increasing emissions faster than GDP have made especially strong progress. A large share of ‘Improvers’ moved from expansive recoupling to absolute decoupling, a turnaround visible in advanced economies and in major emitters across Latin America, Africa and the Middle East. At the same time, a small number of countries have slipped backwards, either due to rapid industrialisation or stagnating growth.
Our sensitivity analysis shows that these results are robust to shifts in the time window. While year-to-year fluctuations — particularly during the COVID pandemic — drive temporary movements between states, the longer-term trend is consistent: more countries are decoupling, and they represent a rising share of the world economy.
The global totals still matter most because climate change is a global problem. But at the country level, the momentum is clear: decoupling is growing more widespread.
Achieving global net zero CO2 requires bending the global curve into a sustained, structural decline. These results show that many economies are already bending their own curves — and that the foundations for accelerated absolute emission reductions, not just decoupling, are in place.
Our calculation and classification taxonomy follows the work of Hong Wang, whereby a decoupling index (DI) value is calculated as the ratio between a calculated emissions index (EI) and growth index (GI). The emissions and growth indices respectively are values reflecting the growth rate of emissions or GDP growth over a given period (Emissions or GDP in year n / Emissions or GDP in year 0).
The calculated DI value allows a straightforward result; DI values below 1 indicate that emissions have grown more slowly than GDP — i.e. decoupling has occurred —while DI values above 1 indicate ‘recoupling’. The combination of EI and GI values allows each country to be assigned to one of six states, shown below.
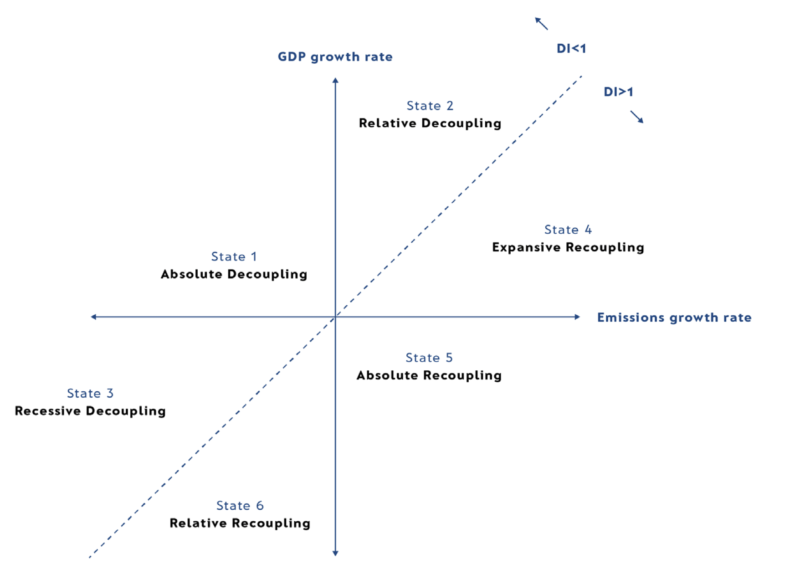
From an emissions and development perspective, absolute decoupling — falling emissions alongside positive economic growth — is the optimum outcome. Relative decoupling occurs when emissions rise but more slowly than GDP. At the opposite end of the spectrum is absolute recoupling, where emissions rise while GDP falls. This state is rare but can appear during periods of acute economic stress, such as during the 2020 COVID pandemic economic downturn.