The Big Four: are major emitters downplaying their climate and clean energy progress?
Real-world evidence suggests at least three will cut emissions faster than their headline targets indicate.
Last updated:

Top-down and bottom-up: two different ways of looking at the world’s progress towards a clean energy future.
From the top down: governments’ grand statements; national development policies; energy system scenarios; and formal commitments to the international community via Nationally Determined Contributions (NDCs).
From the bottom up: the realities determined by policy implementation; companies’ decisions; local markets; and personal preferences.
Like looking through the different ends of a telescope, the picture these two methods portray can vary widely. And although the global headlines on climate change make depressing viewing, at ground level things are changing rapidly.
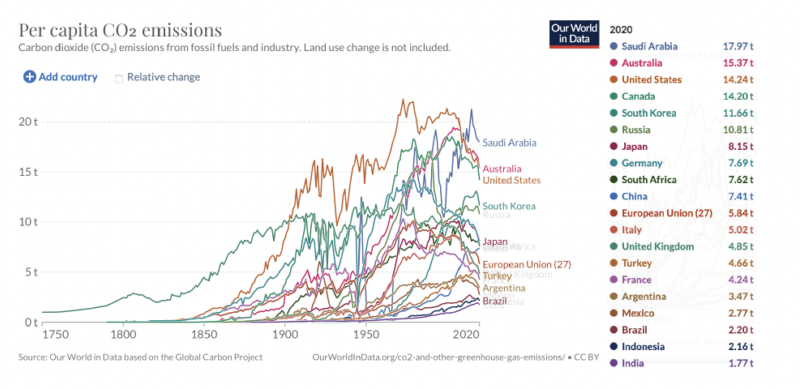

In this report, we look from the bottom up at trends in the world’s biggest four greenhouse gas emitters – China, the United States, the European Union and India. We ask what these might mean for their greenhouse gas emissions. In particular, we ask whether policy implementation, economic trends, business expansion plans and personal decision-making could mean that they are likely to cut emissions faster than their headline statements indicate.

Already at the global level the year’s major reports present a picture of a world tantalisingly poised on a major inflection point. Yes, global greenhouse gas emissions have risen, but by a far smaller amount than the last decade’s average. The International Energy Agency is explicit that the exponentially increasing rollout of renewable electricity generation and electric vehicles has reduced the scale of the rise, possibly by two-thirds. Other analyses show that:
- renewables accounted for all the growth in electricity demand seen in the first half of this year
- wind turbines and solar panels now generate 10% of the world’s electricity, and the current growth rate would take us to 40% by 2030
- electric vehicles are making vast inroads into the mobility market, accounting for 9% of new car sales and nearly half of bus and two- and three-wheeler sales
- this unforeseen rapid rise in electric transportation is already displacing more than a million barrels of oil per day
- the economics of central elements of the clean energy economy (wind turbines, solar panels, heat pumps, batteries, electric vehicles and hydrogen electrolysers) follow Wright’s Law, where increasing deployment leads to cost reductions (and hence faster deployment, further cost reductions, yet more deployment, and so on)
- global investment in clean energy continues to rise, and accounts for almost all new investment in electricity generation.

The evidence presented here makes it likely, we suggest, that at least three of these Big Four emitters – China, the EU and India – will see faster progress towards a clean energy economy and thus towards falling emissions than they have set out in national targets and NDCs.