April Fools: Household bills will rise even if price freeze stays fixed
Household energy bills set to rise in April by an average of £285 compared to previous 12 months - but net zero upgrades are cutting costs for households and Government.
Last updated:

The gas crisis is at the root of the current cost-of-living crisis. Shocks, including the Russian invasion of Ukraine, have driven up gas and electricity prices for households and other customers, driving inflation across the economy.
Resultant volatility in the energy bill price cap, coupled with an array of government interventions to support customers, may well have left households bewildered about where their bills are heading once the price cap changes in April. This report deduces that average energy bills have been £1,945 in the year to March 2023 (FY22/23), and could rise by around £285 to £2,230 for the year from April (FY23/24) when the Government’s £400 discount ends, even as the price cap falls and the level of the energy price guarantee is likely maintained. Each household’s energy bills depend upon its consumption levels for gas and electricity. A private rental home that meets only the minimum standards (EPC band E) would have a bill of £2,510 in the year from April, whereas for a home that meets the Government’s energy efficiency target (band C) average bills would be £2,030. And a household that has been able to install net zero technologies such as a heat pump and solar panels would pay just £1,300.
On top of these household bills, the Government is temporarily paying to subsidise the high cost of gas through the price freeze. Private rental homes that meet only the current minimum efficiency standard are costing the taxpayer an additional £160 over two years compared to an average home, and £270 compared to the Government’s efficiency target of EPC band C. On the other hand, homes with good insulation and net zero technologies are saving the Government, and consequently the taxpayer, £260 each compared to an average home over two years.
April’s winners and losers
The level of a household’s energy bill, and the rise that they will experience in the year from April, depend upon the amount of gas and electricity that a household uses. This is determined partly by the quality of the building’s fabric and the energy technologies that have been installed.
We’ve used four scenarios to help illustrate the impacts on bills come April.
- UK Average: This is essentially an EPC D household (below the Government’s efficiency target of EPC C) with a gas boiler and no technology upgrades.
- Struggling but Insulated: For example, a social housing property upgraded with insulation to meet EPC band C for heating, but otherwise the same as ‘UK Average’, with a gas boiler and no technology upgrades.
- Private Rental: EPC band E for heating and appliances (the worst rating permitted by current private rental regulations), with a gas boiler and no technology upgrades.
- Net Zero: EPC band C for heating and appliances, with an electric heat pump and solar PV.
For each of these four scenarios, the annual costs of gas and electricity were calculated for the year to March 2023 (FY22/23) and the year from April 2023 (FY23/24), as illustrated in Figure 1. These results show that energy for any household is costing significantly more during the gas crisis, but they also show the differences caused by energy efficiency and technology upgrades.
Figure 1: Energy costs over the course of a year, for four scenarios – total costs paid by household and Government combined.
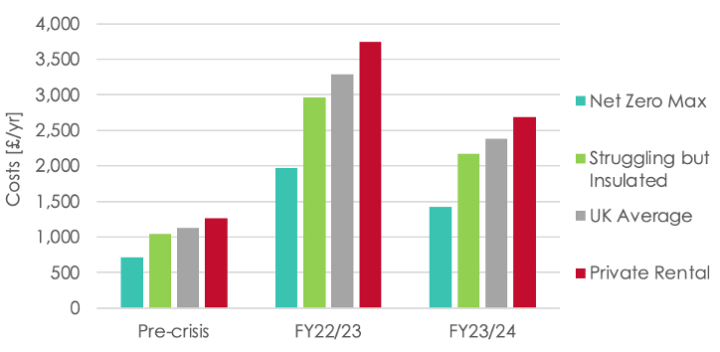
The baseline is the ‘UK Average’ scenario. This household paid around £1,130 per year before the gas crisis. Then, in FY22/23, the energy costs would have been £3,290, with the household paying £1,945 and the Government paying £1,345. In FY23/24, the costs would be £2,380, with the household paying £2,230 and the Government £150. This is on the basis of the Government’s price freeze continuing at £2,500 from April, rather than rising to £3,000.
The results show the extra costs for a household living in lower-quality housing. The total costs in the ‘Private Rental’ scenario would be higher than the ‘Insulated but Struggling’ scenario by around £780 in FY22/23 and £515 in FY2023/24. Of these extra costs, the family would pay £540 in FY22/23 and £485 in FY23/24; and the Government would pay £240 in FY22/23 and £30 in FY23/24. That is, over the two years, insulation upgrades to meet the Government’s target of EPC band C would save the Government £270 for each private rental home that’s currently at the lowest permitted energy efficiency level.
Similarly, the results illustrate the benefits of improved housing quality. For a family in the ‘Struggling but Insulated’ scenario, for example living in good quality social housing, the total costs would be lower than the UK Average by £335 in FY2022/23 and by £210 in FY23/24. These savings would give the household £230 in FY22/23 and £200 in FY23/24; and the Government would pay £105 less in FY22/23, and £10 less in FY23/24.
Furthermore, the results indicate the level of cost savings that can be achieved using insulation, more efficient electrical appliances and energy technology such as a heat pump and solar PV panels. The total costs for home in the ‘Net Zero’ scenario would be lower than the UK Average by £1,320 in FY22/23 and £960 in FY23/24. The family would benefit from £1,095 in FY22/23 and £925 in FY2023/24; and the Government would save £225 in FY22/23 and £35 in FY2023/24 compared to the UK average home. That is, over the two years, insulation and net zero technologies would save the Government, and so taxpayers, £260 per home.
Part of the saving for the ‘Net Zero Max’ scenario is from solar PV panels. These typically cut in half the amount of power that’s bought from a supplier, whilst also providing income from selling surplus power. This contributes £625 in FY22/23 and £615 in FY23/24 to the household’s overall savings noted above.
If the household also installs a battery, it can cut its imports by at least 80%, achieving even larger savings of around £800 in each year, taking the total household savings to £1,260 in FY22/23 and £1,135 in FY23/24, and taking the Government’s total savings to £420 per home over the two years.
Unpicking household bills
The values for bills in this report might not look familiar. The bills cited for a household with average consumption of gas and electricity are not the same as the bills cited for Ofgem’s price cap or the Government’s price freeze. The complexity of prices, support schemes and bills warrant some explanation.
Crisis support
Ofgem’s price cap tracks the costs incurred by energy suppliers, to ensure that households were not overcharged. But when those costs became unaffordable for many, the Government introduced a series of support schemes, some of which have been modified over the past year, and most of which are set to end this month.
The support package has consisted of the following in 2022/23:
- Energy Price Guarantee (EPG, of the ‘price freeze’), which limits unit rates
- £400 Energy Bills Support Scheme (EBSS), a universal discount
- £650 Cost of Living payment for households on means-tested benefits
- £300 pensioner Cost of Living payment
- £150 disability Cost of Living Payment
- £200 Alternative Fuel Payment for households off gas grid
- Household Support Fund of £1bn via local councils
The price cap: seasonal demand and surging prices
Ofgem’s price cap is usually cited as a simple number for each payment type, e.g. £3,280 per year from April 2023 for customers paying by direct debit – but the reality is more complex.
The price cap figure that’s cited is based on average annual gas and electricity usage, of 12MWh and 2.9MWh, respectively. However, the price cap figure isn’t actually the annual bill paid by a household with average demand. It’s the bill that would be paid over a year if the unit prices stayed steady for a full year. But in reality, the unit rates change from one price cap to the next, as illustrated in Figure 2.
Figure 2: Quarterly variation of household demand and unit rates for gas (left) and electricity (right) over two years during the gas crisis, with average pre-crisis prices for comparison.
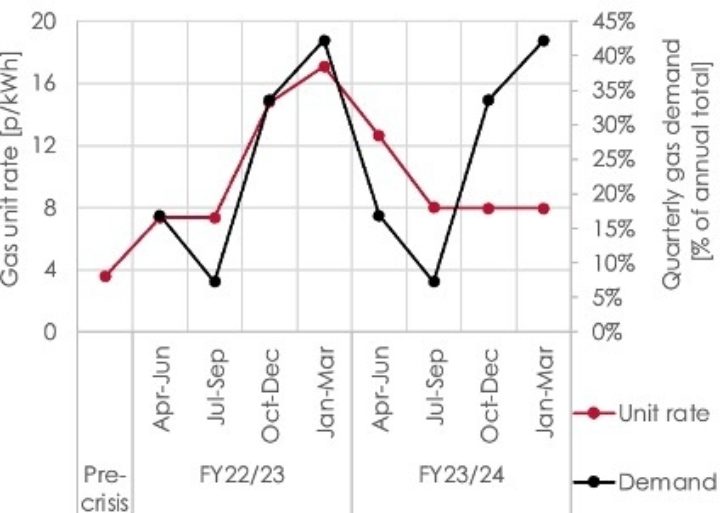
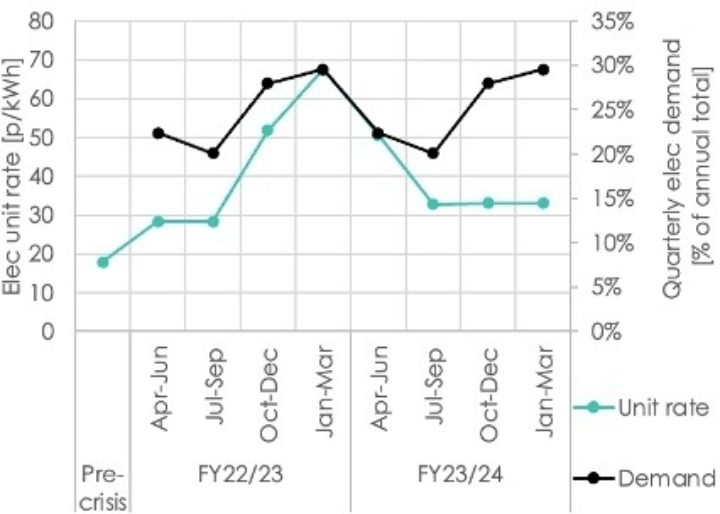
Households typically use about three quarters of their gas in the winter, and only a quarter in the summer. There’s also a seasonal split for electricity, albeit less dramatic. There’s a bigger contribution to annual bills if unit rates are higher when demand is higher, as was the case this winter.
Before the gas crisis, this seasonal factor was a lesser issue because the underlying unit prices varied by no more than +/-10% from one price cap to the next, and the dual fuel bill was always around £1,100–1,200. So, the value quoted for any six-month price cap, whether summer or winter, was fairly applicable to the whole year.
The gas crisis made this simplification untenable. Price caps, which are now changed every three months to try to keep up with market volatility, have had huge changes in unit rates.
This can be illustrated for FY22/23. For Apr-Sep 2022, the price cap figure was quoted as £1,971. Then for Oct-Dec 2022, the gas unit rate rose by 100%, the electricity unit rate by 81%, and the price cap figure was quoted as £3,549. And unit rates rose even further for Jan-Mar 2023, with the price cap figure quoted as £4,279.
But none of these quoted figures was the annual bill for FY22/23 for a household with average consumption. Instead, the actual bills paid over the course of a year are the sum of the bills paid under each different price cap. This is illustrated in Figure 3. (Another way to put this is that the bill for the year is the ‘weighted average’ of prices and consumption levels over the year, plus the standing charge.)
Figure 3: Quarterly household bills for gas (left) and electricity (right) in two years of the gas crisis, with pre-crisis annual bills for comparison.
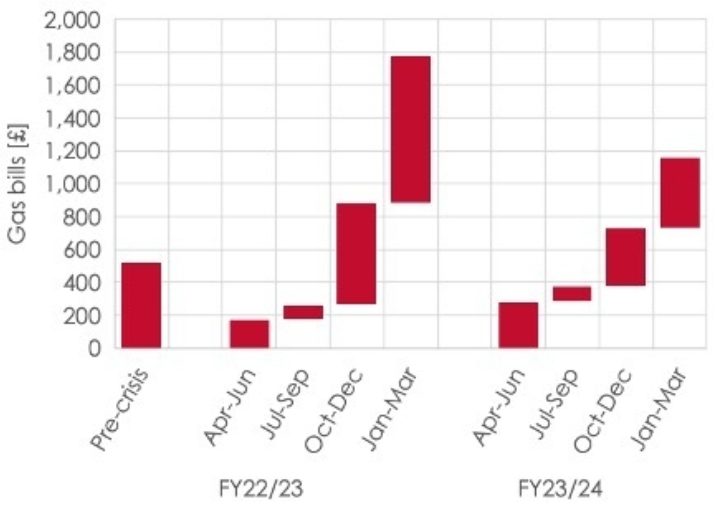
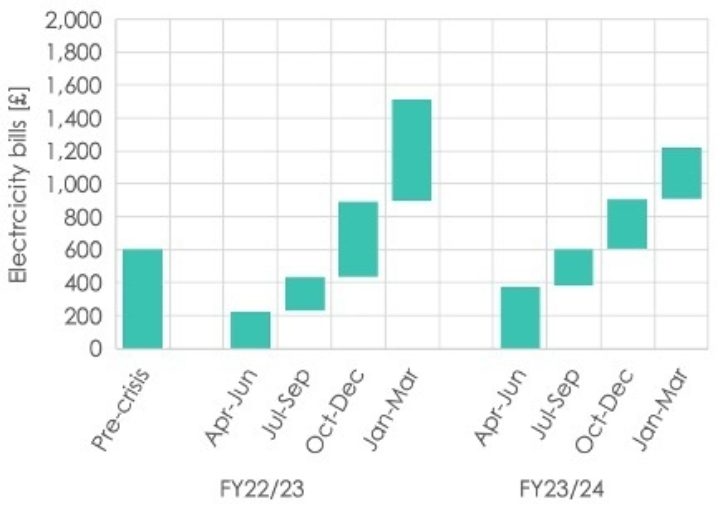
Based on price cap data up to June 2023 and forecasts to March 2024, dual fuel costs (total for households and Government) are calculated to be:
- £3,290 for 2022/23, i.e. last April to this March
- £2,380 for 2023/24, i.e. this April to next March
The price freeze: cutting prices, for a limited time
The Government introduced the Energy Price Guarantee (EPG), known as the ‘price freeze’, in October 2022 as a separate instrument alongside the price cap. The price freeze limits how much of the unit rates are paid by households, with the Government paying the difference to suppliers to cover their costs.
Like the price cap, the price freeze is expressed as a single number: a household with average consumption will pay no more than £2,500 a year. But, like with the price cap, this single figure is not the whole story.
The £2,500 figure would be the annual household bill if the scheme ran for a full year. But, with the price cap forecast to fall below £2,500 in July, the price freeze will have been in place for only nine months (the latter six months of FY22/23 and the first three months of FY23/24).
Taking into account the duration of the price freeze, Figure 4 illustrates how costs would be split between the household and the Government, if the price freeze was the only support mechanism – which it isn’t.
Figure 4: Annual dual fuel costs for average household demand, showing costs covered by the Government’s EPG. For FY23/24, two options are shown: the price freeze remaining at £2,500 or rising to £3,000.
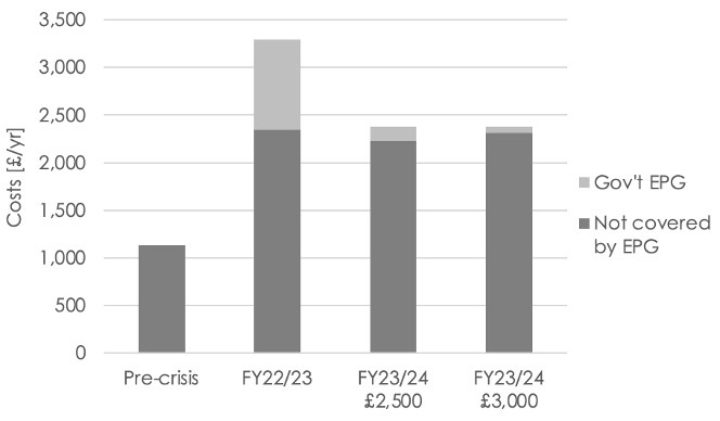
The costs to the Government of the price freeze are as follows:
- £945 in FY22/23
- £150 in FY23/24, if price freeze stays at £2,500 from April
- £65 in FY23/24, if price freeze rises to £3,000 from April
This shows that keeping the price freeze at £2,500 from April would cost the Government around £85 for each dual fuel home, or towards £2.5bn overall, as has been estimated previously.
But for households, this is not the end of the story.
Next steps: a future shock
Recent debates have focussed on whether the price freeze will be kept level from April, but that effect is small compared to changes to other support schemes.
This winter, the Government has given all households a £400 non-repayable discount on their energy bills. This Energy Bills Support Scheme (EBSS) is not due to be continued into FY23/24. The impact of this change is shown in Figure 5.
Figure 5: Dual fuel bills for average household consumption, split between household and Government, including the impact of the Energy Bills Support Scheme (EBSS).
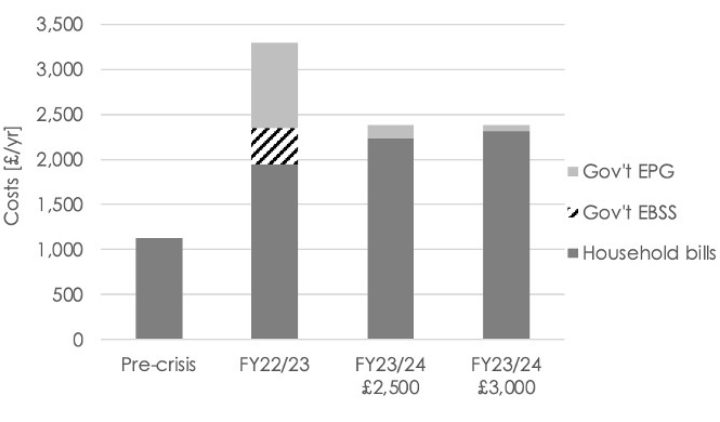
The combination of the price cap falling during FY23/24 but the EBSS ending in April, means that average household energy bills will likely be higher this coming year from April (FY23/24) than in the current year to March (FY22/23).
Based on the data used, average bills have been £1,945 in FY22/23, and could rise by around £285 to £2,230 for FY23/24. There is some uncertainty about prices from July onwards, but it is unlikely that they will cancel out this £285 increase.
There is also uncertainty over whether high prices forcing households to reduce their energy usage. However, if households reduce their usage by the same amount in both years, they would see an increase in bills in FY23/24.
For households that cannot afford to spend more than a set amount on energy, and that have already had to cut their energy usage in the year to March, they would have to reduce their consumption even further in the year from April.
Some households are receiving additional support in FY22/23, as noted earlier in this report. It is not clear whether any of these schemes will continue into FY23/24. If not, then these households will experience a larger jump in bills.
Furthermore, millions of customers are struggling with high energy debt (arrears and repayment plans). This reached £2.5bn Q3 2022, and will still be increasing. This, in effect, will mean that not only will energy bills increase in FY23/24, but there will be a higher debt bill that will increase costs for struggling households.
Lessons from the cost-of-living crisis
This analysis has highlighted two unfortunate facts. Firstly, the energy component of the cost-of-living crisis is not going to ease any time soon. Despite falls in wholesale energy costs and in the price cap, the actual bills facing households are set to be higher in the year from April than they were in the year to March.
Secondly, the cost-of-living crisis is worse than it needed to be because of the poor quality of the UK’s housing stock, with households paying hundreds of pounds a year more than is necessary. Slow progress on improving energy efficiency since 2012 means that millions of existing homes have not been upgraded to EPC band C, as targeted by the Government.
However, the analysis reiterates one of the key lessons from this gas crisis. Using less energy is guaranteed to save money compared to a less efficient option, under any prices. If the UK moves faster to upgrade its homes with insulation and net zero technologies, we will be better prepared for a future gas crisis – and more able to avoid a subsequent cost-of-living crisis.
Methodology
This analysis uses the following data:
- Price cap data up to June 2023 from Default Tariff Cap model, v15 (Ofgem, February 2023)
- Price cap forecasts up to December 2023 from Cornwall Insight (20 February 2023). The analysis then continues the prices for Q4 2023 into Q1 2024.
- Demand levels: TDCV of 12MWh for gas, and 2.9MWh for electricity (Ofgem); and by EPC bands from NEED tables 27 & 28 (BEIS)
- Quarterly demand profiles are averages of 2016 to 2021 from Energy Trends 4.1 & 5.2 (BEIS)
- Efficiencies: gas boiler 85%; heat pump COP 3.0
- Solar PV: 3kW installation, load factor 11%, giving 2,890kWh output per year; without battery assumes 50% self-supply and 50% exports; with battery assumes 80% self-supply and 20% exports; unit rate for exports is taken to be 25% of the prevailing import unit rate (based on current Octopus tariff).
The analysis makes certain simplifying assumptions about how demand varies during the year for homes whose demand is not average, i.e. it takes the level of annual demand for a particular home and assumes that it follows the quarterly profile of an average home. More detailed modelling could take into account that heating demand dominates the variability in the gas quarterly profile, whilst hot water demand for gas is constant throughout the year. But hot water demand accounts for only 20% of annual demand, and so the simplification does not significantly affect the modelling outputs or change the conclusions.