Energy bills – here we go again
MPs are under pressure to act on bills; but why are companies putting them up?
By Jonny Marshall
Share
Last updated:
By Dr Jonathan Marshall, ECIU Energy Analyst
Energy companies are in the news again. Prices are going up and MPs are getting annoyed, and rightly so – energy bills can swallow more than 10% of income in the poorest households.
Anger is pouring towards utilities for pocketing huge profits, paying extremely healthy salaries to top brass, and offering less-than-stellar customer service. Hence the House of Commons is holding a debate on Thursday to try and figure out what can be done about it.
Many companies have pointed to ‘factors outside their control’, such as rising policy costs or swings in the wholesale price of gas and electricity, as the reason behind price hikes.
However, a new report from the Committee on Climate Change (see box below) clarifies that overall, energy policies key to decarbonising the system have lowered bills. In this blog we take a look at some of the factors that frequently foot the blame, and attempt to outline how much of a factor they really are.
The ‘green crap’
Easily stigmatised and touted as one of the most common causes of price rises, if you believe 'Big Six’ press releases, social and environmental policy costs are an easy scapegoat when costs rise.
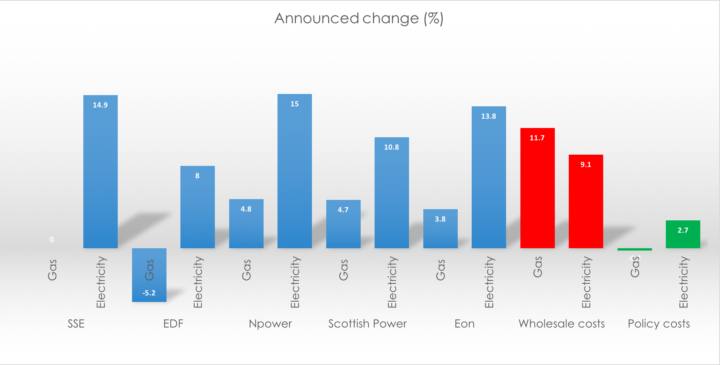
'[The increase is] due mainly to the rise in non-energy parts of the bill such as social and environmental schemes,' said Eon, while RWE justified part of the 15% increase on electricity bills on grounds of 'rises in the costs of government policies'.
However, in the real world...
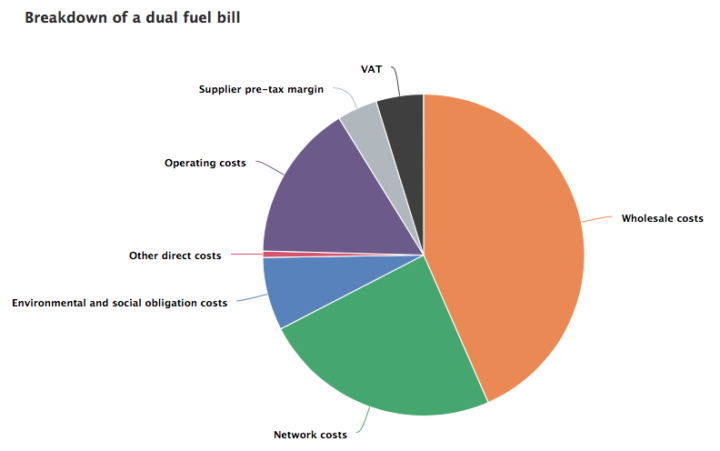
Ofgem figures shows that 13% of electricity bills and just 2% of gas bills are due to social and environmental costs, which support the neediest in society in addition to investing in renewable generation. This equates to around 9% of a dual fuel bill.
These levies can also lead to a reduction in the nation's overall energy bill by funding energy efficiency schemes that cut demand. Loft insulation, for example, can cut up to £240 from annual fuel bills.
By far the largest components of household bills are wholesale and network costs (the price respectively of buying gas molecules and electrons, and the cost of transporting them through pipes and cables across the country).
Ofgem's recently launched Supplier Costs Index clearly outlines the components of fuel bills, presenting consumers with enough information to identify why their bills are changing. By far the largest changes over the past 12 months have been in the cost of buying gas and electricity from wholesale markets – a result of fossil fuel prices recovering in the final quarter of 2016, and the post-Brexit devaluation of the pound boosting the cost of importing gas and coal.
Policy costs on electricity have increased by around 2.5%, an order of magnitude less than the 36% hike claimed by Eon, whereas policy costs on gas bills have marginally fallen.
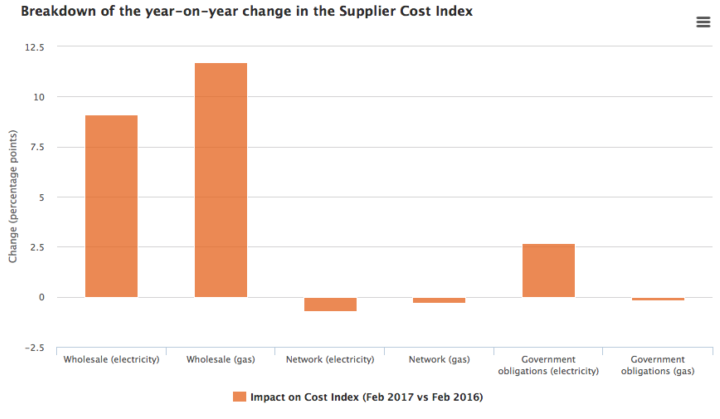
Network costs for both gas and electricity have fallen slightly over the last year. While this offers temporary respite for bill payers, it is unlikely to continue in a longer term. The UK’s electricity network is one of the oldest in the world, and needs investment to maintain the high reliability standards we are accustomed to as well as to build the smart grid that will, in the end, cut costs.
Recent reports have linked rising wholesale prices to the proliferation of renewables on the UK system. A clever - and, one trusts, entirely accidental - juxtaposition by the House of Lords Economic Affairs Committee implied the two were linked, diverting attention from the clear links between the wholesale price of electricity and the wholesale price of gas.
Policy costs make up a fraction of household bills, but they are set to rise in future as the amount of clean energy project built under subsidy rises. However, to focus on this is to miss the bigger picture of a system in transition, to one that can eventually be subsidy-free and give consumers more control over their energy use.
Bills up by £73 per year
The wholesale market is largely out of the control of utilities – although large trading and origination teams help somewhat – and has been clearly responsible for the lion's share of bill increases.
CCC – Cost of climate action on bills
A report out today (16 March) from the Committee on Climate Change confirms that action to cut emissions has not bumped up household bills. The cost of measures to improve energy efficiency and increase low-carbon generation have been more than offset by savings due to cutting energy waste. In 2016, climate measures added around £9 to bills, but the £20 saving due to reduced energy demand more than compensated for this.
It also shows that, in real terms, energy bills are falling. Due to declining consumption, dual fuel bills are now £115 lower than in 2008 – contradictory to announcements from utilities suggesting otherwise.
Further forward, the cost of green measures will continue to be more than countered by efficiency savings, which must be music to the ears of UK families and to energy ministers, as falling bills and falling carbon emissions begin to go hand-in-hand. By 2030, the CCC estimate savings of £150 per household from cutting waste, writing off the £85-120 increase due to low-carbon electricity generation.
However, investment in renewables is exacting a downward pressure on wholesale costs. Why companies try to divert attention from the dependence of prices on wholesale costs could be an interesting avenue to explore in the Commons debate.
Another vital point which is usually absent from energy bill discussions is the amount of energy used in UK households.
When for example SSE announces a £73 bill rise, the language used seems to assume constant and unchanged energy use.
However - and despite a dramatic increase in the number of electronic goods per household - energy efficiency improvements and other factors mean demand is falling. Even simple measures, such as switching lightbulbs to LED have been shown to have a dramatic effect on peak UK demand (affecting the number of power stations needed, and ultimately the figures in our bills).
Government figures for electricity bills, for example, assume that household consumption has not changed in years. This may be useful for comparing unit costs – the price of turning a 100W light on for one hour, for example – but are not reliable indicators of household outlay.
In 2006, the average UK household consumed approximately 5,300 kWh of electricity. Ten years later this figure had dropped to around 3,900 kWh – a fall of around one quarter.[1]
It is essential when discussing energy bills to account for the fact that we are using less energy; failing to mention this adds further unnecessary smoke and mirrors to discussion of UK energy policy.
Pointing the blame
Energy bills are a complex subject, relying on multiple variables which are in turn dependent on macroeconomics, global markets, social policy and numerous other factors. Ofgem has done sterling work in its supplier cost index in adding some clarity to the debate, however confusion is still fanned by politically charged reporting in sections of the media.
Many are calling for a cap on prices, something ECIU outlined the pros and cons for a in a 2016 blog. Armed with facts needed for the debate, Thursday’s debate should make for interesting viewing, with deep ramifications for UK utilities in years ahead.
[1] ECIU calculation based on ONS and BEIS data.
Share