A hot year doesn't prove climate change, just as a cold one doesn't disprove it
2014 may be the warmest on record - but beware of over-claiming
By Richard Black
Share
Last updated:
By Richard Black, ECIU Director
2014 is on course to be the warmest year on record, according to the US National Oceanic and Atmospheric Administration (NOAA).
Barring a major volcanic eruption, this year will almost certainly eclipse 2005 and 2010 as the hottest since records began.
The World Meteorological Organisation (WMO) will formally reveal the latest estimates from NOAA and the other two most cited temperature records this week on the sidelines of the United Nations climate summit in Lima, Peru.
Environmental campaigners may be tempted to use the announcement, when it comes, as proof that climate change is real, raising pressure for governments to finalise a new global climate agreement in a year's time .
While this is entirely understandable, a single hot year doesn't prove anything; and over-claiming that it does is only likely to prolong an argument that is, frankly, over.

Regressive tendencies
There are four reasons why one hot year does not and cannot be an argument for the reality of climate change, man-made or not.
Firstly, the key is always the long-term trend.
And you cannot measure a climatic trend by the difference between two years, whether they’re consecutive or not, when many indicators of climate change vary naturally from year to year and decade to decade.
The annual surface temperature is just about the most variable of the lot. It can change by tenths of a degree from one year to the next, and by several tenths if the El Niño-La Niña cycle is in the mood for extremes or if a volcano as big as Mount Pinatubo should blow.
It varies over timescales of decades due to other natural cycles, although the mechanisms are imperfectly understood at present.
So the argument that you can start with the average surface temperature for the single year 1998, assess each successive year against it, and draw something meaningful from those pairs of numbers has always been – to use the technical term – rubbish, whether the conclusion is that there has or has not been warming.
The second reason why individual years shouldn’t be over-egged is summed up in that familiar phrase ‘what goes around, comes around’.
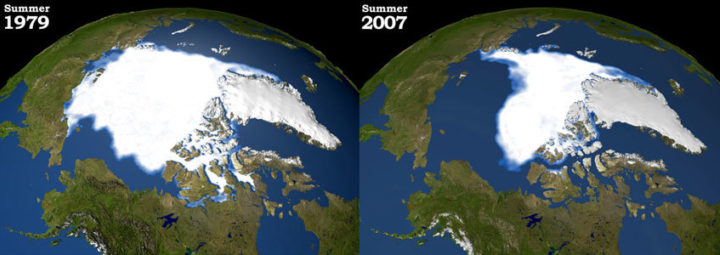
2012 set a new record for the summer melting of Arctic sea ice, breaking the 2007 figure with ease. This prompted environment groups to warn that 'the loss will be devastating', and speak of 'an alarm call from the Arctic'.
Unfortunately, there’s a phenomenon in statistics called ‘regression towards the mean’.
In layman’s terms, if in one year you have extreme conditions that set a record, the next year is likely to see conditions closer to the average and so not set a new record.
This is, in fact, what happened, with fresh records not being set in 2013 and again in 2014, allowing climate sceptics to argue (falsely) that the Arctic ice had ‘recovered’.
If you make a claim when an extreme value comes along, expect a counter-claim when the next one doesn't - and hence, a meaningless dispute. Again, the key issue is the long-term trend, and this is what serious observers should be concentrating on.
Questions of confidence
The third reason for caution is that not all global temperature records are the same. Methodologies vary – and so, therefore, do the exact conclusions.
So while NOAA currently has 2014 as the warmest on record, NASA’s equally valid global dataset has it in second place. The third major record, maintained by the UK Met Office and the University of East Anglia, puts 2014 in third position.
In addition, all of them come with margins of error. NOAA’s record for the year so far to October, for example, gives a margin of plus or minus 0.11C.
By comparison, from the same record, the annual average temperatures for all the years between 2001 to 2013 fit within a range of 0.10C.
Often, then, claims of record-breaking need to be caveated with words such as ‘probably’, ‘appear to be’ and ‘within limitations of the data’ – which automatically make them seem less than earth-shattering.
The fourth and most important reason is that picking out a single bit of data can be seen as betraying a lack of confidence in the overall scientific picture.
The phenomenon of the ‘global warming pause’ (really a 'slowdown') never seriously challenged the overall scientific evidence base for man-made climate change, even though it raised entirely legitimate questions about why the temperature rise slowed and what it means – questions that eventually proved constructive in that they have led to further research and so better understanding.
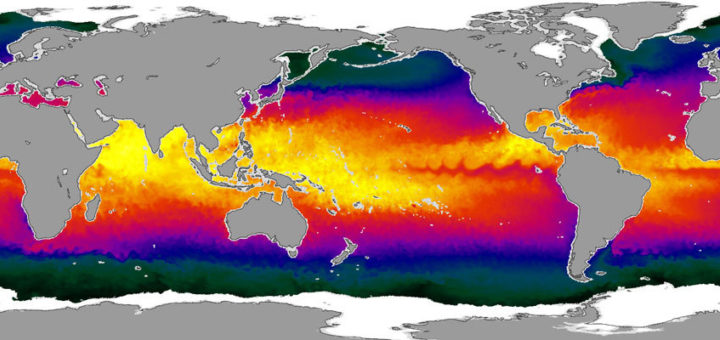
The continuing accumulation of heat in the Earth system is warming the ocean, shrinking glaciers across the world, raising the sea level, changing weather patterns and causing species to migrate - among other things.
Accumulating carbon dioxide is also changing the pH of the ocean.
None of those trends has slowed. And whether 2014 turns out to be the warmest, second warmest or even tenth warmest in various institutions’ records does not change the overall picture - which includes accelerations and decelerations in the rate of surface temperature rise.
As an indicator of climate change, the average surface temperature is special in just one way: it is the only indicator that has a political target attached.
Governments have not agreed anything analogous to the 2C temperature target for indicators such as sea level rise or ocean acidification. But these trends all affect the ecological health of the biosphere and prospects for humanity.
Climate change is not proven by a single hot year, just as it is not disproven by a single cold winter. The big picture is far more important – and far more interesting.
Share