Out with the old – gas crisis blows up conventional wisdom about household bills
With the old rule of thumb on gas bills out the window, let’s break down the price rises.

By Dr Simon Cran-McGreehin
@SimonCMcGShare
Last updated:
Volatile international gas prices, driven in part by Russia slowing the flow of gas to Europe, have provided a stark reminder to British households of just how exposed they are to the whims of global fossil fuel prices. But with four in ten customers saying they don’t understand their energy bills, they deserve an explanation of why the costs are rocketing.
Three important facts are clear…
Firstly, it’s the cost of gas that is causing gas bills to soar. Last April, gas wholesale costs accounted for £200 of the average gas bill under Ofgem’s price cap; currently the figure is £300; and by this April it will likely reach £600.
Secondly, electricity bills are rising less than gas bills, because gas power stations generate only part of our electricity, and cheaper renewables are insulating us from the gas price spike. Taking the two bills together, most analysts anticipate that the average dual fuel bill will have risen by around 60% over the year from April 2021 to April 2022, dominated by an 80% rise in gas bills compared to 40% for electricity.
Thirdly, levies on bills are much lower than the cost of gas and are not contributing in any significant way to the bill increases. Indeed, levies on gas to fund insulation for poorer households and levies on electricity for insulation and renewable energy have helped to lessen the shock felt by contributing to less gas being used than otherwise might be the case.
The old rule of thumb
For the past few years, the average annual gas bill under Ofgem’s price cap has oscillated around £500 (see endnote for more about other types of bills).1 A useful ’40:40:20’ rule of thumb could be applied to this average bill (again, see more detail in endnote).2
- 20% for the standing charge (£100)
- 80% for unit costs, of which:
- 40% for gas costs (£200)
- 40% for other variable costs (£200)
The ‘standing charge’ is paid by everyone, no-matter how much gas they use, to fund things like the gas pipes which we all need regardless. The ‘unit costs’ cover all the things that depend on how much gas we use, and include the cost of the gas itself and a basket of other costs such as managing the gas system. 2.5% of the bill funds insulation for vulnerable households through the Energy Company Obligation (ECO) and the Warm Homes Discount (WHD). So in April 2021, the cost of gas was 16 times the portion of the bill for insulating poorer homes to reduce their heating bills.
Wholesale gas cost drives ballooning bills
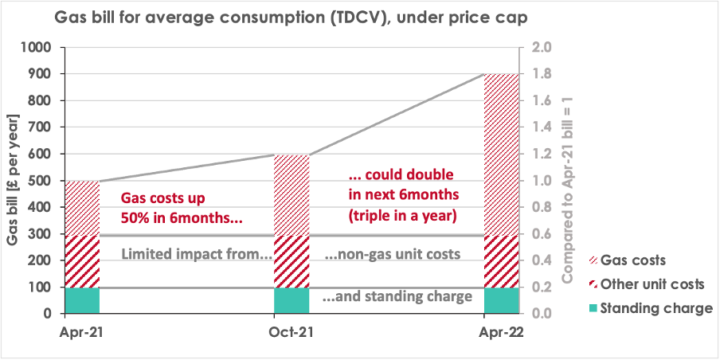
The record increases in gas costs seen in 2021 and 2022 are so large that they dwarf any changes in the other costs. The old rule of thumb was spectacularly blown apart by the explosion in gas costs during 2021, which led to gas bill hikes from £500 in April to £600 in October (up 20%) and are leading to forecasts of £900 for this April (up 50% from October, and up 80% in a year).
These changes are illustrated in the chart, for the average bill calculated by Ofgem’s price cap methodology, and using an estimate for this April’s costs. (Oddly, the examples in Ofgem’s press releases don’t quite match the averages in its model, and it doesn’t explain why – but the differences are comparatively small.)

The price cap set by Ofgem takes into account prices that suppliers paid on the wholesale gas market during an earlier six-month period, measured in ‘pence per therm’ (confusingly, different to the ‘pence per kilowatt’ on bills). Ofgem doesn’t show exactly what wholesale data it uses, but it does publish some data that shows the trends. (Our analysis is explained in this endnote.)3
The inescapable fact is that it’s the cost of gas that’s driving almost all of the huge increases in bills. Levies to fund insulation for vulnerable households were small even before the gas crisis (2.5% of the average gas bill in April 2021, i.e. about £12.50. Under the higher bills of April 2022, that would equate to 1.4% of the gas bill, and we’d be paying 48 times more for gas (£600) than for measures to reduce heating bills for low-income households.
Away from the average
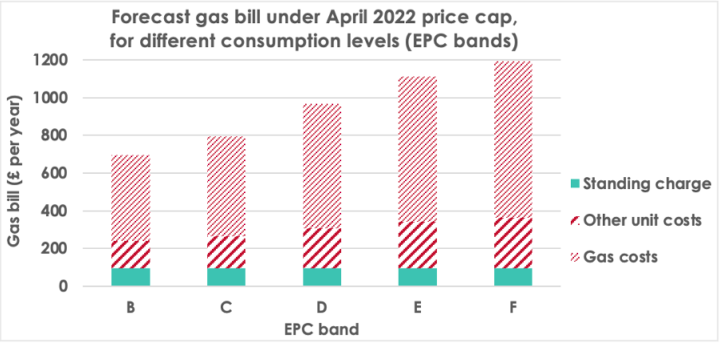
The results above can be used to forecast gas bills for homes whose gas usage differs from Ofgem’s ‘TDCV’ average value. The chart below shows the average gas bills homes in different bands of the Energy Performance Certificates (EPCs) scale, based on the cost estimates for the April 2022 price cap. It clearly shows that improving energy performance (with band B being better and F being worse) reduces heating bills. With UK average demand being a little better than the average for band D (the most common type of home accounting for 44% of homes, with a forecast bill of £970 from April 2022), there is plenty of scope for improvement. (This analysis is explained in an endnote.)4

A simple model for a new reality
With pressures on the international gas market showing no signs of letting up, it looks like wholesale gas costs will continue to dominate gas bills throughout 2022. Indeed, with the risk that Russia could turn off the taps causing price spikes in Europe at any time, the UK might never again be able to rely on the old assumptions about gas prices.
Footnotes
[1] Ofgem’s price cap applies to 11million households that pay default tariffs by direct debit; it has become the most commonly quoted measure of energy bills, and is used in this analysis. Other bills can also be quoted, such as the average bill under the price cap for the 4million households that use prepayment meters, and the average bills of the remaining 12million households that are not under a price cap.
Ofgem bases its price cap calculations on an average annual gas usage of 12,000units (called kilowatt-hours, or kWh for short), the so-called ‘Typical Domestic Consumption Value’ (TDCV). Obviously, a household that used more (or less) than average consumption would pay more (or less) than the £400 on variable costs (again, see below for more on that).
Gas is used in about 85% of UK homes; in most of those cases it is used for heating (typically about 80% of demand) and hot water (around 20%), and sometimes for cooking (a very small contribution).
Note that all figures in this analysis include VAT at 5%, and that prices have been rounded to the nearest £10 to avoid spurious precision.
[2] This rule of thumb is based on Ofgem’s price cap for default tariffs(which applies to 11million households) for April 2021, and is deduced as follows. (It also broadly applies to other households with average consumption but different tariffs.)
- All of Ofgem’s calculations are based on an average annual household gas consumption, called ‘Typical Domestic Consumption Value’ (TDCV), of 12,000kWh.
- Ofgem’s price cap model (sheet 1b) shows that the average gas bill under the April 2021 price cap was £498 (including VAT at 5%), which we’ve approximated to £500.
- The price cap model (sheet 1b) also shows that the average standing charge (it varies across the UK) was £97 for the April 2021 price cap, which we’ve approximate to £100 (around 20% of the average bill). This left £400 (80%) for the variable part of the bill.
- Ofgem data shows that, as of August 2021, wholesale gas costs made up 41% of the average gas bill – which we’ve approximated to 40% and have assumed that it applied to the price cap for April to September 2021 during which it was published.
- Taking 40% for gas costs and 20% for the standing charge leaves 40% for other variable cost, such as network management and levies to fund insulation for vulnerable households.
The price cap model (sheet 1b, again) shows that gas bills and standing charges had fluctuated around those levels for a few years, so this rule of thumb had been a useful guide.
[3] The contribution of each cost component to the growth in gas bills was estimated as follows – an extension of analysis published in September 2021.
- The wholesale gas cost averaged about 42p/therm in August 2020 to January 2021, which helped to set the April 2021 price cap.
- Then the wholesale gas cost grew by around 50% to average 62p/therm in February to July 2021, which directly caused a 50% (£100) rise in the gas part of the bill, and pushed the total bill up by 20% (£100) for the October 2021 price cap – as per the first chart. Other cost components varied only slightly (e.g. the standing charge fell by £2).
- We’re currently almost at the end of the data gathering window (August 2021 to January 2022) for the April 2022 price cap, and the figures are pointing to an average wholesale gas cost of around 125p/therm, triple the level a year ago. So, the gas part of the bill would be three times larger, and the bill would have grown by 80% (£400) in a year – again, as per the first chart.
[4] The average bill under Ofgem’s price cap can be translated into bills for homes with non-average consumption, as follows:
- The average standing charge is taken to be £100 per year.
- Unit costs (£ per year) can be analysed using the fact that in April 2021 they were equally split between gas and non-gas costs (see endnote i). So, the 50% hike in gas costs for October 2021 translated into a 25% increase in unit costs. And the forecast tripling of gas costs would make the unit cost twice the size they were in April 2021.
- Unit rates (p per kWh) were calculated by dividing the variable costs by Ofgem’s gas TDCV of 12,000kWh per year, giving unit rates of 3.3p/kWh for April 2021, 4.1p/kWh for October 2021, and a forecast of 6.6p/kWh for April 2022.
- Then, the gas bill of any home can be forecast by multiplying its gas consumption (for example, the average for homes in an EPC band) by the unit rate, and then adding on the standing charge.
- Because of the fixed standing charge, a percentage difference in consumption doesn’t translate to the same percentage difference in bills.