Decarbonisation is getting cheaper. Why?
Reducing emissions has turned out to be far cheaper than the Committee on Climate Change expected
By George Smeeton
Share
Last updated:
Efforts to tackle climate change took a boost recently when the UK became the first major economy to set a legally-binding net-zero target. Cutting the UK’s greenhouse gas emissions by at least 100% by 2050 compared to 1990 levels will cost up to 1-2% of GDP annually until 2050, said the Committee on Climate Change (CCC). Notably, this is no higher than the expected cost to meet the previous target of an 80% cut in emissions compared to 1990, despite being considerably more ambitious.

Renewable power is getting cheaper, faster than expected
Back in 2008, the CCC developed a scenario in its first advice to government for what would be needed in different sectors in order to meet the UK’s first three carbon budgets. The budgets are restrictions on the total amount of greenhouse gases the UK can emit, as required in the UK Climate Change Act. The scenario wasn’t a prediction as such but it indicated what the CCC expected might happen over the period 2008-2022, based on assumptions about economic growth and other socio-economic factors.
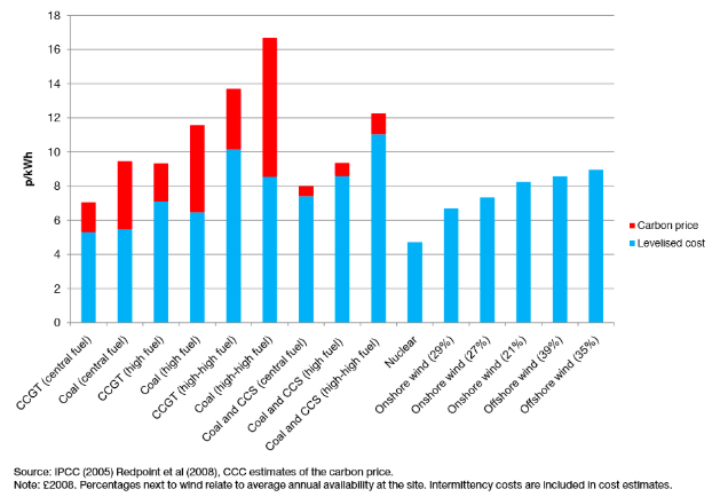
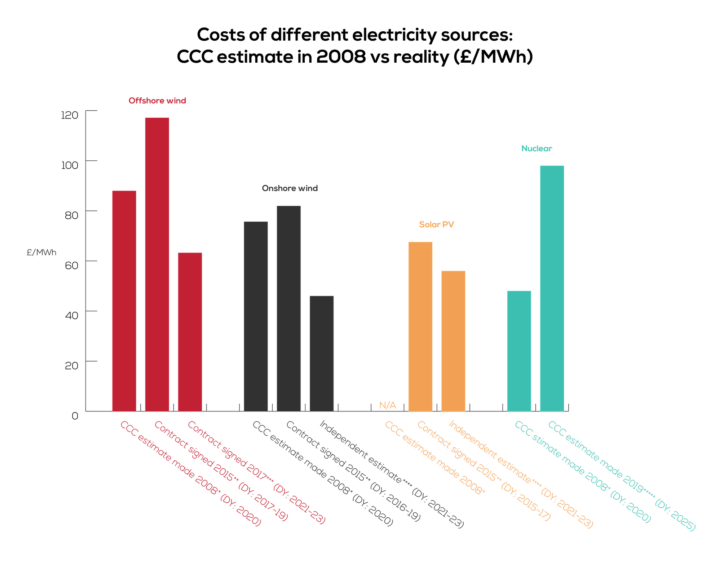
Averaging across high and low wind scenarios, the CCC’s estimate for the ‘levelised’ or lifecycle costs of offshore and onshore wind by 2020 were around £88/MWh and £76/MWh, respectively (expressed in 2008 prices, see right-hand bars in the chart below taken from the CCC’s 2008 report). Interestingly, high costs and the ‘limited sunshine resource of the UK’ led the CCC to suggest that the potential for emissions reductions from solar PV was ‘very small’ within the first three budget periods.

So how do the CCC’s expectations stack up against reality? Compared to the CCC’s estimate of around £88/MWh in 2020, the cost of offshore wind generation dropped to under £65/MWh in 2017 (expressed in 2012 prices). This is based on the second allocation of Contracts for Difference (CfD), the government’s flagship mechanism for supporting low-carbon electricity generation.
And compared to the CCC’s estimate of around £76/MWh in 2020, an independent estimate suggests new onshore wind capacity could be installed for around £46/MWh (expressed in 2012 prices). Note: there were no onshore wind projects awarded CfD contracts in the second round of allocations as the technology was excluded from competing (and also from the third round, which opened in May 2019).

Even without the conversion from 2008 to 2012 prices for an apples-to-apples comparison, the fall in price for offshore and onshore wind clearly exceeded the CCC’s expectations when it first advised the government on long term emissions targets in 2008. Also exceeding expectations, UK electricity generated from solar PV has risen to 12.9TWh in 2018, and now accounts for 3.8% of total UK electricity generation (335TWh) and 11.6% of total renewable electricity generation (111.1TWh). According to an independent estimate, the cost of installing new solar PV capacity is now around £56/MWh (Note: solar PV was also excluded from the second round of CfD allocations).
As the CCC explains in a recent report summarising the UK’s progress (or lack of it) towards meeting the Second Carbon Budget, specific strong UK policy measures have contributed to driving down the cost of renewables, notably Contracts for Difference, Renewables Obligation and Feed in Tariffs. But while the CCC notes that the falling cost of renewables is ‘clear evidence that emissions can be driven down by a well-designed, comprehensive policy package’, this is one of very few good news stories. The less-than-complementary summary points out renewable electricity generation was one of only seven out of 24 indicators assessed to be on track in 2018. (In fact, the second carbon budget was met overall - as was the first - but largely due to accounting changes to the EU Emissions Trading Scheme and, to a lesser extent, slower than forecast economic growth, rather than effective policy measures.)
Electric vehicles and batteries
While the CCC notes the ‘abatement opportunities’ from surface transport in its 2008 report, it attributes the potential over the first three carbon budget periods (2008-2022) largely to improving fuel efficiency of conventional vehicles. Electric cars have ‘inherent performance and carbon efficiency advantages and the only - but important - issue holding back their growth is battery capacity, weight and cost’, the report said. But noting some progress already underway, the report adds that there could be ‘a major role’ for plug-in electric cars and for full electric cars by 2020.
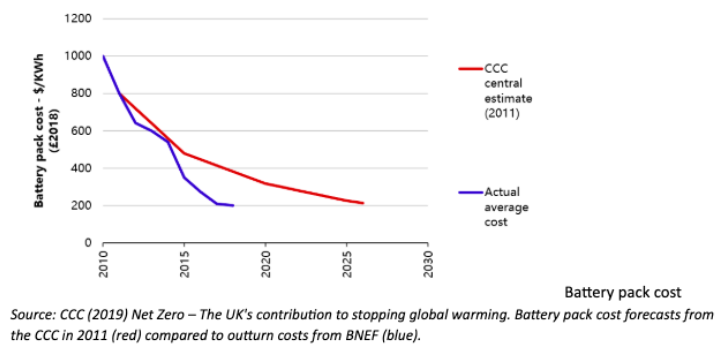
In fact, the average cost of battery packs fell much faster than the CCC expected, from around $1,000/kWh in 2010 down to less than $210/kWh in 2017 - a fall of around 80%. In 2019, the CCC says that while electric vehicles are currently more expensive than petrol and diesel vehicles ‘recent analysis indicates that cost parity in both lifetime and purchase cost is likely to be reached before 2030 in several developed countries including the UK.’

A word on nuclear, CCS and Biofuels
The ‘economic case for nuclear power deployment is strong’ and it is already ‘close to competitive’ on price with fossil fuels, said the CCC in its first report in 2008, alongside the prediction that three new generation reactors could feasibly be built by 2020. But with the industry beset with problems and delays, the latest CCC estimate of the cost of nuclear in 2020 is £98/MWh and only one out of six proposed new nuclear reactors is currently under development.
In 2008, the CCC also highlighted that biofuels and CCS could play potentially important roles in reducing emissions from the transport and power sectors respectively. But in 2019, biofuels account for just 2% share of kilometres driven and against the backdrop of rapid development of electric vehicles, future applications are largely limited to aviation. Meanwhile, the status of CCS in 2019 is ‘still at the technology development and demonstration phase’. Happily, the CCC’s expectation in 2008 that electricity demand would continue to increase overall (after an initial drop thanks to energy efficiency measures) has not materialised. In fact, electricity demand dropped as a result of EU standards for electrical products (though the CCC now projects a doubling by 2050 due to extensive electrification of heat and transport.
Future direction
Looking back to the CCC’s first advice to government in 2008, it’s clear that decarbonising the UK economy has cost far less than expected. Two main developments can take most of the credit for that: mass deployment of low carbon electricity generation and battery packs for electric vehicles.
Looking ahead, trends in the global energy system suggest that the strong growth of renewables will continue, the CCC notes. But it also makes clear that a major ramp up is needed to get on a net-zero track: ‘Government has still not developed a route to market for the lowest-cost forms of low carbon generation such as onshore wind and solar...This limits the potential speed of decarbonisation and adds to costs.’ The CCC plans to update its cost projections as part of advising on the sixth carbon budget but one thing is for certain, notes the Rt Hon. the Lord Deben, CCC Chairman in the foreword to the net-zero report, ‘the lesson of the last decade is that costs fall when there is a concerted effort to act.’
* £2008, levelised cost (including intermittency averaged across different wind speed categories), Fig 5.17 CCC (2008) Building a low carbon economy
** £2012, strike price averaged across multiple projects from CFD allocation round one
*** £2012, strike price averaged across multiple projects from CFD allocation round two (onshore and solar excluded)
**** £2012, Baringa et al. (2017) for Scottish Renewables
***** £2018, levelised cost, CCC (2019) Net Zero – The UK's contribution to stopping global warming
Share